Many professional forex traders have been using support and resistance levels as part of their forex trading strategies to trade the currency market. Besides currency trading, there are other financial instruments like stocks which also use support and resistance. It is considered to be one of the most powerful ways to trade forex as it is based on price actions itself.
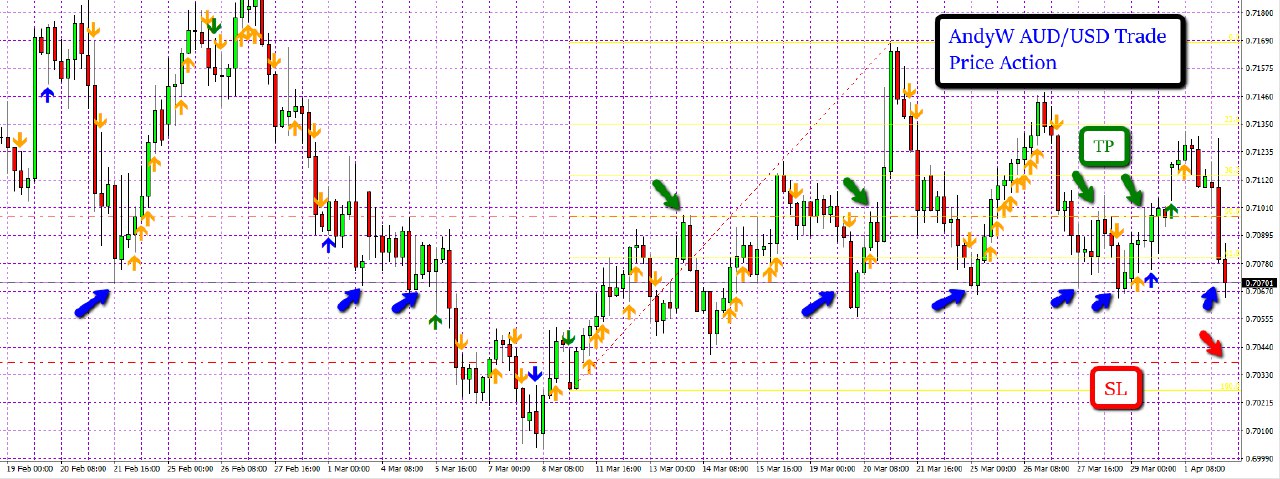
If you want to follow my trading strategy that based on support and resistance techniques, you can join AndyW Club and get my exclusive Forex trades, analysis and signals notifications via dedicated APP, E-Mail or Telegram. Click Here and Join AndyW Club Today – You Can Cancel Anytime, No Questions Asked!
Support and Resistance Forex Trading Techniques
Support and resistance trading is understood as once the price reaches a certain level, it may stop, find it hard to break through that level and then reverses. When traders are able to identify these activities, they will be able to gain huge profits from the forex financial market. Support levels are identified when buyers push the price up when price reaches a certain level which finds it hard to break through. Vice versa for resistance levels.
How to Spot Support and Resistance in Forex Charts?
We will now look at how we spot resistance and support levels on the Forex charts. There are a few Forex trading techniques to spot those levels but I will list those that are more commonly and effectively used.
The top five support and resistance Forex trading techniques are:
- Moving Averages – Some moving averages value may have an impact on the currency market and they are the 200 EMA (Exponential Moving Average), 100 EMA, 62 EMA and 23 EMA. When price reaches the EMA levels, sometimes it tests the levels, bounces off and reverses. That is why they are used as support and resistance levels and even used for Forex day trading strategy.
- Trend Lines – We draw trend lines to give us an idea on how trendy the market is when the price travels up or down. This is also known as channels and let us predicts how the price will move. For example, when the price is trending up, we draw a up trend line, so when the price breaks below the trend line significantly, we know that it is a breakout and the trend will change. Vice versa for trending down.
- Pivot Points – This is one of the Forex indicators that is based on previous period. It can be used by breakout traders or range-bound traders. For breakout trades, prices which are above the pivot are considered bullish while below are pivot are bearish. Using pivot in Forex trading systems, after the range-bound traders identify the upper resistance or lower support levels, they will place sell or buy orders, and target profit at S1, S2 or R1, R2 respectively.
- Chart Patterns – Some of the examples are ascending/descending triangles, double top/bottom, head and shoulders and reverse H & S..
- Fibonacci Levels – When we draw swing low to high or swing high to low, we use the Fibonacci levels of 23.6%, 38.6%, 50.0% and 61.8% as support and resistance levels. For example, when it is swing low to high, traders may buy when the price hit one of the levels, as that is support in this case. Some traders may only trade when the price went out of the 61.8%, which means a reversal of trend.
The key to master these Forex trading techniques mentioned above is to experience it yourself.
If You Want to Become a Successful Forex Trader, You Must Join AndyW Club.