Today I’m going to start discussing the very interesting and useful topic of Japanese Candlesticks in Forex trading charts.
There are several tools you can use to determine wise entry and exit points. One set of tools involves looking at Forex trading charts. At AndyW Club, Japanese candlesticks are being used in virtually every trading chart that will be used on the blog, so it’s good to learn how to read them
What is a Japanese Candlestick in Forex Trading?
Forex charts reveal patterns and can be good predictors of future movement because traders are habitual. While Forex charts can be displayed in several different ways, Japanese candlesticks are the most popular way of looking at charts.
Japanese candlesticks display price versus time in any time period. The candlestick could represent any time interval, though we will focus on 1 minute, 5 minute, 1 hour, and 1 day candles.
The time interval refers to the “size” of the candle, or the amount of time that passes between the open of the candle and its close.
Japanese Candlesticks Can Be Charted On Any Time Frame
The horizontal axis of a candle chart represents that time frame. The time frame could be 15 minutes, 30 minutes, 1 hour, 1 day, 1 month, 1 year, and so on.
In other words, if you are looking at 1 minute candles on a 15 minute chart then you will see 15 candles represented; if you are looking at 1 day candles on a 1 month chart then you will see approximately 20 candles (there are about 20 trading days in the average month).
Bullish Japanese Candlestick Patterns vs. Bearish Japanese Candlestick Patterns
Japanese candlesticks are very useful for quick visual analysis of charts because you can easily identify whether the bulls or the bears won the tug-of-war of a certain period.
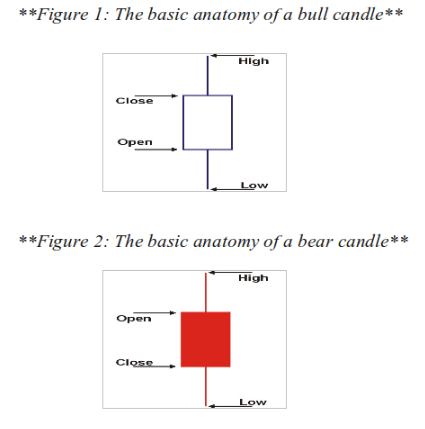
If the bulls won, then the candle formed during that period (which could be one minute, five minutes, one hour, one day, etc.) is called a bullish candle. Bullish candles can be spotted easily because they are unfilled (the body is not colored in).
The color of the candle will depend on the chart, on this blog bullish candles are usually be blue, though you might see bullish candles elsewhere outlined in black or green.
If the bears won the tug-of war of a certain period, then the candle representing trading during that period is called a bearish candle. Bearish candles can be spotted easily because they are filled (the candle’s body is colored in).
The color of the bearish candle will depend on the chart – on this blog they are outlined and filled in red (though you may see bearish candles elsewhere outlined and filled in black).
If You Want to Become a Successful Forex Trader, You Must Join AndyW Club.