Irrespective of its direction, gauging the strength of a trend is one of the crucial steps to make in trading. While there’s a number of tools to use to assess the strength of a trend, the Average Directional Index (ADX) is a great technical indicator that can help you achieve this.
How does the ADX Indicator Work?
ADX’s value is expressed between 0-100, with values under 20 signifying a weak trend and values higher than 50 indicating a strong trend. The process of calculating the ADX is usually complex, but to keep it simple, the ADX is high if the trend is strong.
On the other hand, if the value of the indicator is low, it indicates that the price is either going sideways or hovering in a particular range. If you see that the ADX is higher than 50, that usually means that the price has gained momentum and is moving in a specific direction.
When compared to other oscillators, such as Stochastic, which tells us whether the trend is bullish or bearish, the ADX only evaluates the strength of the existing trend.
Traders mostly utilize ADX to determine whether the market is in a range or at the start of a new trend. ADX is viewed as a non-directional technical indicator because it’s predicated on comparing the highs and lows of bars and doesn’t take into account the close of a bar. If you plan on using the ADX indicator in trading, think of 20 and 40 as crucial levels.
ADX Indicator Trading Strategy
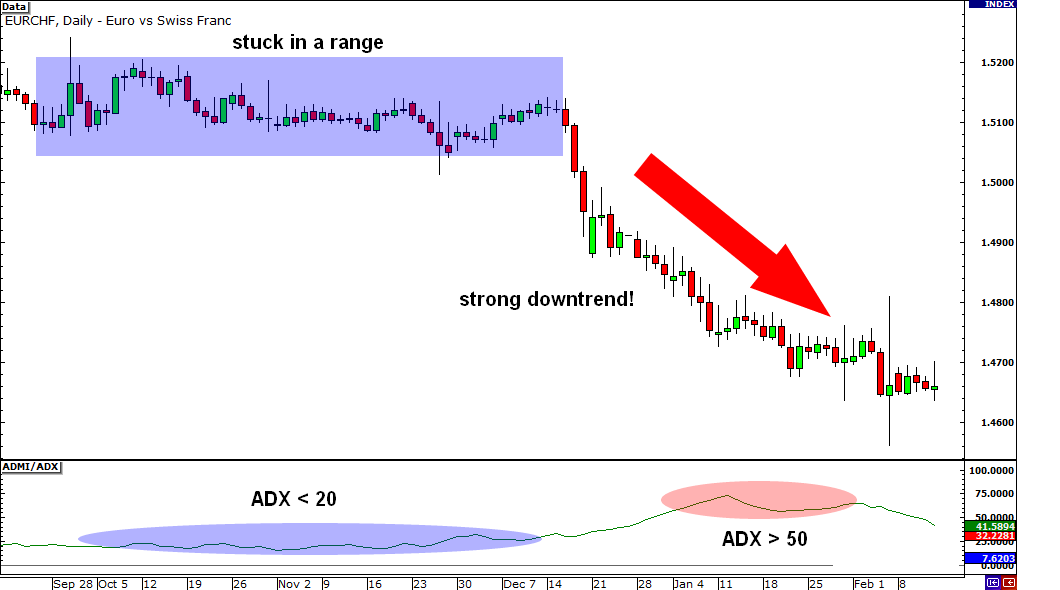
In the example above, the ADX remained below 20 in the period between September and late December. As you’ve probably noticed, the EUR/CHF pair was caught in a range during that period.
In January, the indicator broke above 50, indicating a potential start of a strong trend. However, the pair dropped below the bottom of that range and was caught in a sharp downtrend.
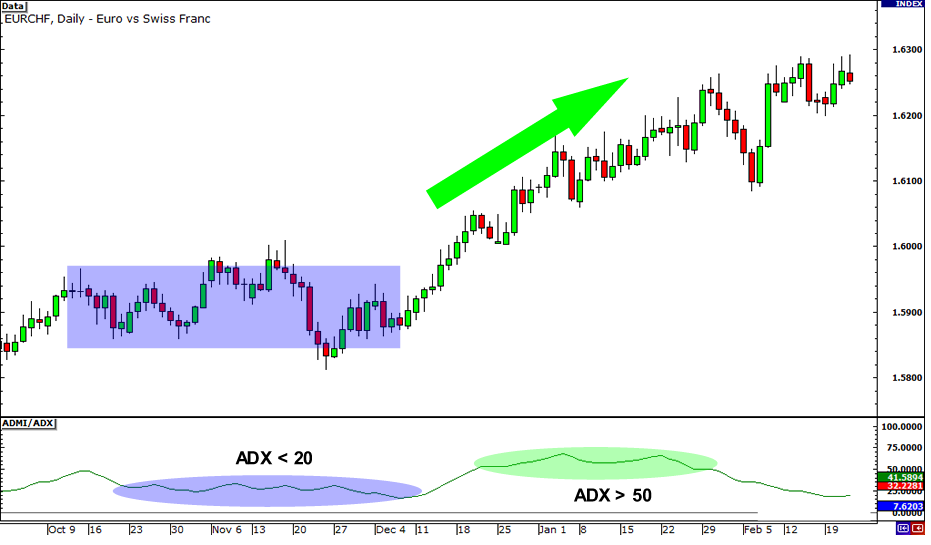
Similar to the first picture, here the ADX also levitated below 20 for some time and the pair was stuck in a range. However, this time, after ADX broke above 50, the pair broke through the top of the range and a strong uptrend occurred.
Therefore, it’s really important to understand that this indicator doesn’t provide you with buy/sell signals but rather tells you whether you should hop on the current trend or not. If the indicator falls below 50 once again, it indicates the weakening of the current trend and the trader should probably try to retain profits.
When trading, one way to take advantage of the ADX is to wait for price breakouts before opening a position. The indicator is often used by traders to confirm whether the pair is likely to continue moving in its existing trend or not.
Alternatively, you can use the ADX in conjunction with other indicators, especially ones that can tell you the pair’s direction. Ultimately, ADX can also help you decide whether you should close a trade early.
For example, if the indicator breaks below 50, signalling that the trend is likely losing momentum. As a result of a weakening trend, the pair is likely to go sideways so closing a trade early might be the best decision in that case.
If You Want to Become a Successful Forex Trader, You Must Join AndyW Club.