TradingView is a popular web-based charting platform that offers traders a broad set of charting features. It offers a lot of different features which can help you become a better Forex trader.
Create a TradingView Account
To get started, you need to create a TradingView account. You need to navigate to their website and sign up. Fill in the sign-up form and verify your e-mail address.
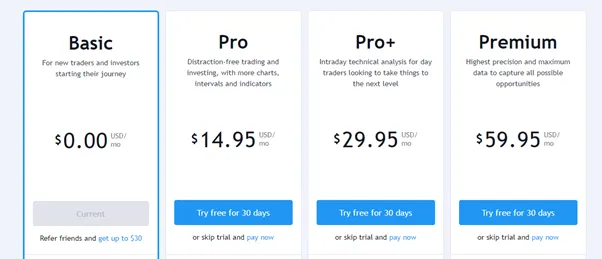
When signing up, you can choose between the free version of TradingView or one of the three paid subscription options that offer some additional features.
How to Open a Chart in TradingView?
To open a chart, click on the Chart button at the top of the page. This will bring up a default charting area that looks like this:
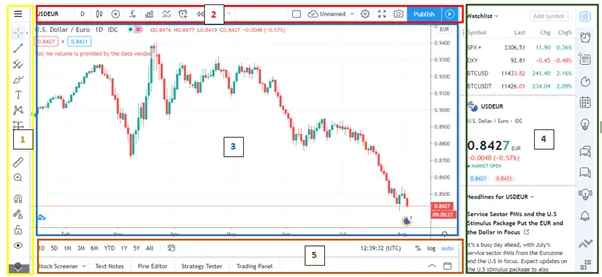
When you first open a chart, it will load as a candlestick chart. However, TradingView allows you to customize chart options and settings. To do this, navigate to the by right-clicking in the main charting area or by clicking on the gear icon in the top toolbar.
Doing this will pop up a new charting settings window where you can make various changes to the color of the charts, background, time-zones, trading options, cursor type and so on.
How to Read Market Prices?
The simplest way to read a current market price is by looking at the chart, where the price is displayed on the chart price axis. On the other hand, you can open the Watchlist window in the right toolbar and read the latest market prices.
Changing the Chart Time Frame
TradingView also allows you to change the chart’s time frame.
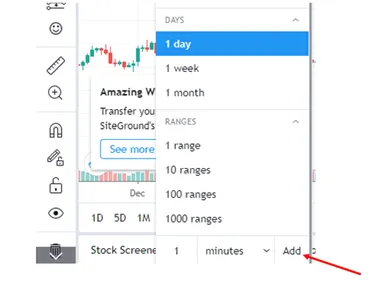
This can be done by clicking on the time interval icon on the top toolbar.
![]()
This will bring up a dropdown menu where you can make changes to the chart’s time frame. If the time frame you want to use is not there, you can manually enter the number for your preferred time frame at the bottom of the dropdown menu.
If you want to zoom in or out of the chart or scroll back to earlier periods, hover your cursor over the main charting area and use the respective zoom in/out or scroll back/forward icons.
How to Use Indicators in TradingView?
Traders use technical indicators all the time. To add them in TradingView, click on the Indicators icon in the top toolbar. This brings up a huge list of different indicators to choose from.
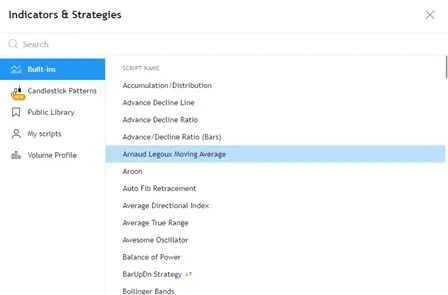
- The ‘Built-ins’ indicator category includes more than 100 different indicators that come with the platform.
- Indicators under the Candlestick Patterns category help you identify candle patterns on a chart.
- The Public Library lists indicators made by the platform users.
- My Scripts display the indicator scripts created using the Pine Editor.
- The Volume Profile indicator displays the most-traded prices over a certain period.
How to Place Orders in TradingView?
The most common way to place an order in TradingView is by right-clicking the chart and selecting Trade>Create a New Order.
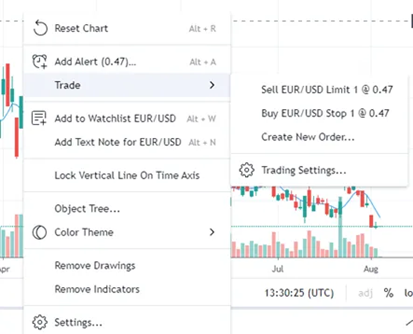
A trade order panel will pop up. This is where you can choose the desired market order you want to use, enter the preferred price, set the position size, and place a trade by selecting either the “Buy” or “Sell” buttons. When opening a new position, you can also enter stop-loss and take-profit levels.
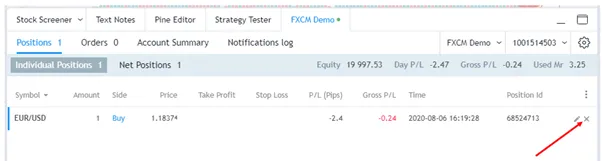
To close a position, navigate to the “Positions” tab under the broker tab and click on the “X” on the right of the position you want to close.
In conclusion, TradingView is a great trading platform that offers tons of different features which can significantly boost your chances for success. This article covers the essential features of TradingView but the best way to really learn the platform and all of its features is by creating an account and spending time with it.
If You Want to Become a Successful Forex Trader, You Must Join AndyW Club.