Traders widely use different trend-following strategies in the Forex market as it’s one of the most common ways to take a position. They develop their trend-following strategies with the help of different trend indicators.
In this article, you will learn about 5 most common indicators that will help you identify a trend’s direction and its strength.
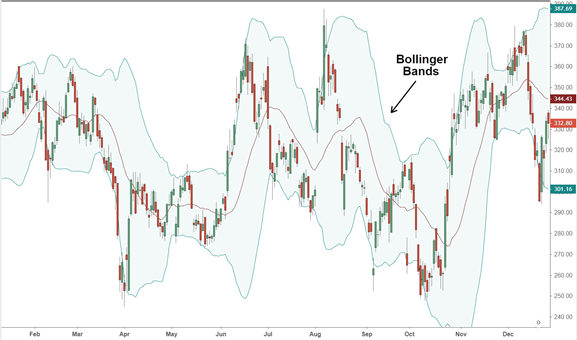
Bollinger Bands
Bollinger Bands is arguably the most popular trend indicator among traders. It consists of three bands that closely track the asset’s price.
The middle band is typically a moving average while the edges/bands closely follow the price and show its volatility. As the bands get closer to each other, the volatility lowers and it’s a matter of time before a breakout occurs.
ADX
ADX is another massively popular trend indicator. ADX reflects the strength of a trend, which represents vital information in trading. The value of ADX is measured between 0 and 100. If ADX is below 20, it indicates weak trending conditions, while an ADX value above 40 is likely to provide you with a reliable trade entry.
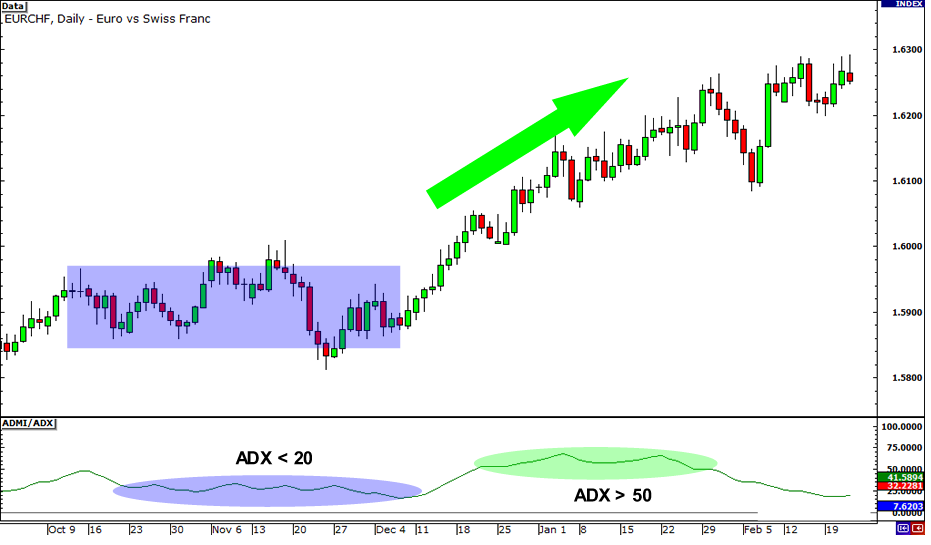
If you see that ADX is falling, it usually signals that the market is becoming less directional and the weakening of the running trend. It is advised to keep from trading trend systems if the trend changes.
Moving Average (MA)
The Moving Average is also used as a trend indicator which outlines previous prices. This indicator is displayed as a line on your chart. While it’s a lagging indicator, the MA is widely used by traders to identify the direction of a trend, as well as its strength.
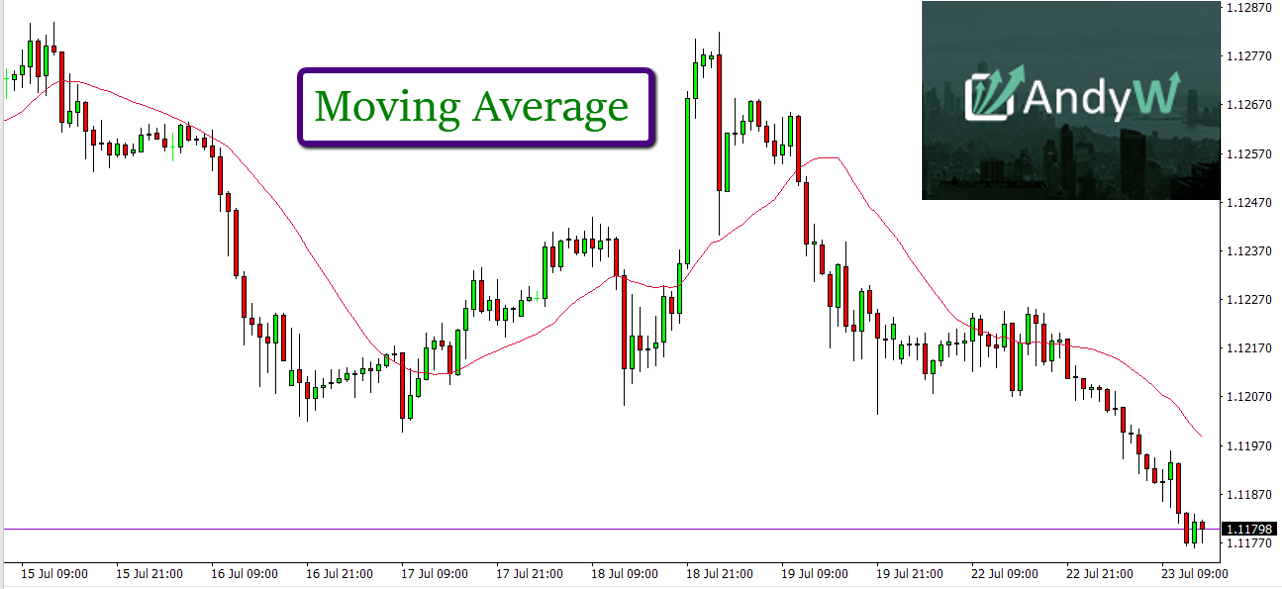
When it comes to identifying its direction, the rule of thumb is that if the price is higher than 200MA, you’re looking at a long-term uptrend. On the other hand, if the price is below 200MA. As for using the MA to measure the strength of a trend – in a strong trend the price is likely to stay above 20MA.
MACD
The Moving Average Convergence Divergence (MACD) histogram is one of the most reliable trending indicators used by traders as it instantly reflects the trend’s nature.
To use it for following a trend, plot the histogram against the indicator’s line.
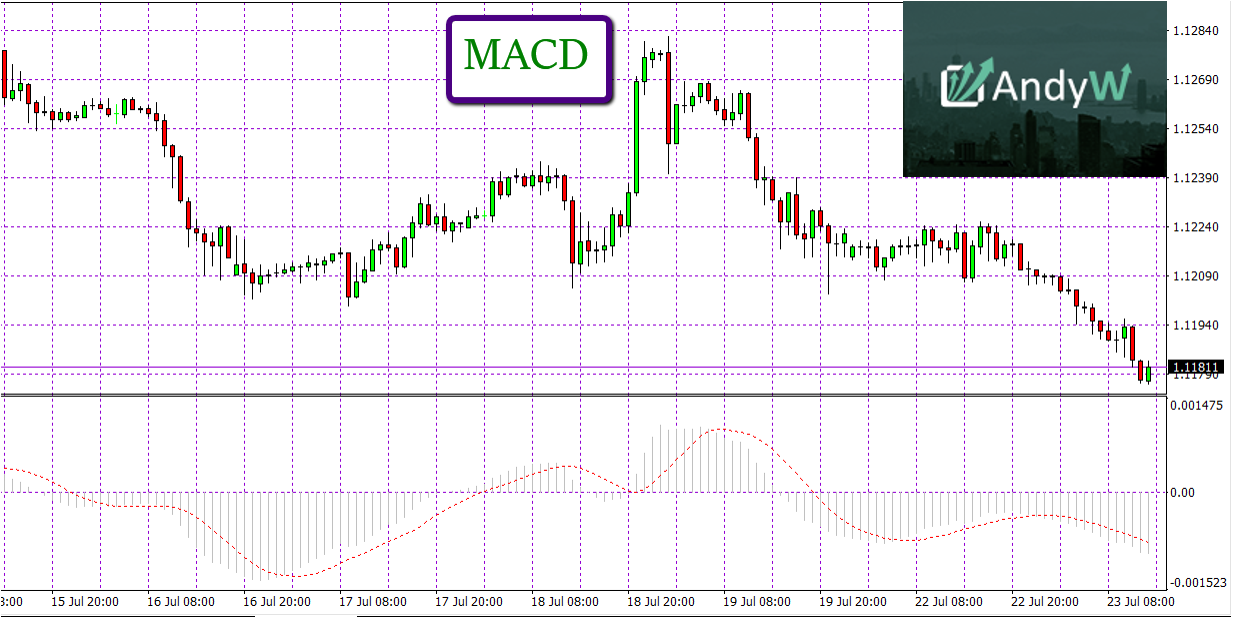
In case of a bullish trend, the MACD histogram is positioned below the indicator’s line. In this instance, the market will move in your favour. On the other hand, once the histogram breaks above the MACD line, it could be a sign of a potential bullish reversal or a weakening of the bearish trend.
Parabolic SAR
Parabolic SAR is another indicator every trader should know about. Its strength lies in its ability to compute future values based on the previous ones.
Also, by the time Parabolic SAR places a dot on the chart when indicating bullish/bearish conditions, it will stay in its place. In other words, it remains there without regard to future price action.
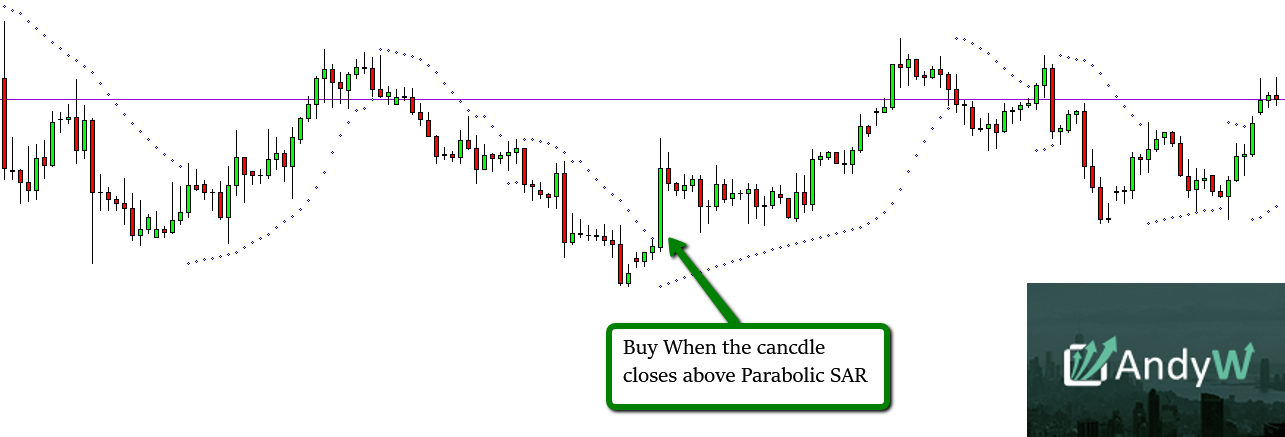
Traders mostly utilize the Parabolic SAR in short-term trading or to scalp the market, due to the fact that the market rarely creates powerful trends.
In conclusion, the popularity of trend indicators is much higher nowadays due to the mass adoption of online trading. While all of the mentioned indicators are extremely helpful in trading, there is no such indicator which is 100% accurate all the time and that’s why whichever indicator you plan to use, make sure you have a solid money management strategy.
If You Want to Become a Successful Forex Trader, You Must Join AndyW Club.